Dashboard
The scherlok dashboard command turns the local profile store into a single-file HTML report.
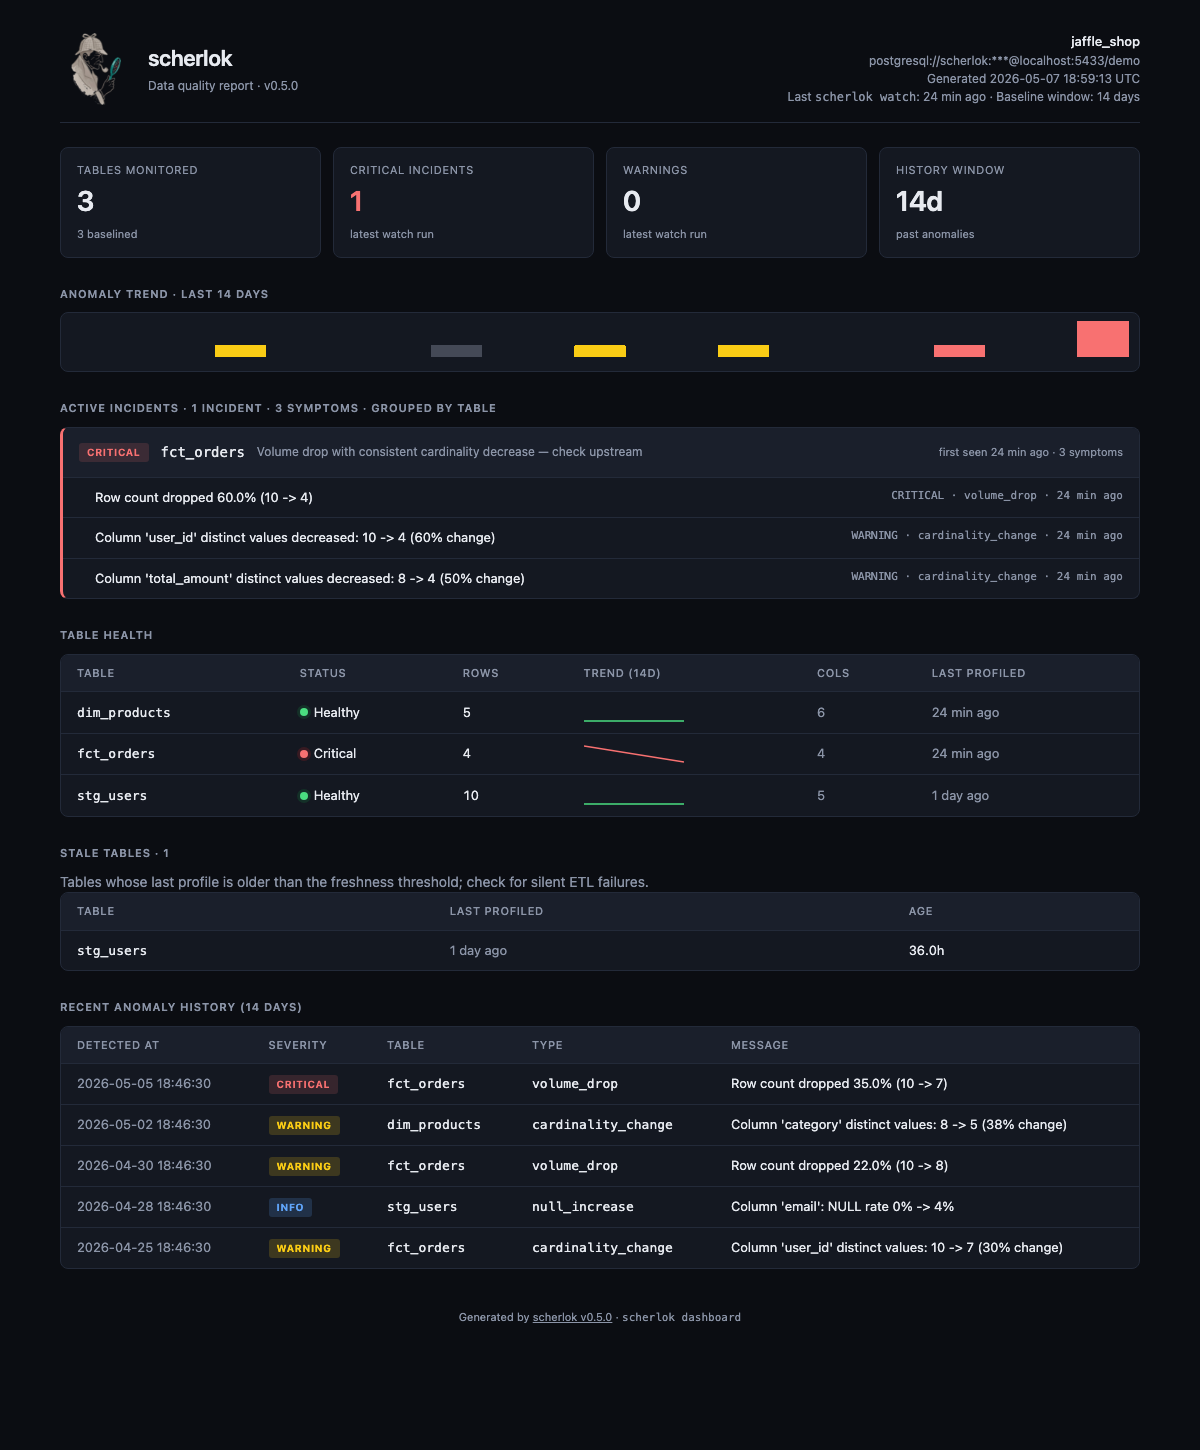
Quick start
scherlok dashboard --out report.html
The output is a self-contained HTML file (~28 KB): no external CSS, no fonts to download, logo embedded as base64. Open it in any browser.
Options
| Flag | Default | Description |
|---|---|---|
--out / -o |
scherlok-report.html |
Output path |
--days / -d |
14 |
History window for the "Recent anomalies" section |
--theme |
auto |
auto (follows OS), dark, or light |
--project-name |
derived | Override the header label |
What the report shows
- Header KPIs — tables monitored, critical / warning incident counts, history window
- dbt context — only when the report is generated after a
scherlok dbtrun (omitted otherwise) - Active incidents — grouped by table. One card per table with all related symptoms, threshold info, and
first seen / last seentimestamps - Schema drift — rendered git-diff style:
+added,−removed,~type changed, with old → new types - Table health — one row per profiled table with status dot, row count, inline sparkline, last profiled, column count
- Recent anomaly history — full
--dayswindow with per-anomaly timestamps
How it composes
ProfileStore
    │
    ├── get_anomaly_history(days)   ─┐
    └── get_latest_profile(table,*)  │
                                     ▼
                          assembler.assemble_view()
                                     │
                                     ▼
                          grouping.group_anomalies()
                                     │
                                     ▼  (renders Symptoms with detected_at,
                                        Incidents with first_seen/last_seen)
                                     ▼
                          schema_parser.parse_schema_anomaly()
                                     │
                                     ▼  (collapses 3 schema-drift anomalies
                                        for the same table into 1 Symptom
                                        with a SchemaDiffEntry list)
                                     ▼
                                template.html
                                  + styles.css (embedded)
                                  + logo (base64 embedded)
                                     │
                                     ▼
                                report.html
Out of scope
The dashboard is intentionally read-only. Anything that requires state, identity, real-time updates, or cross-tenant aggregation is out of scope:
- Acknowledge / suppress / resolve workflow
- Multi-project / multi-DB single pane of glass
- Scheduled hosted runs
- ML-based seasonality detection
- Lineage from query logs
- SSO / RBAC / audit log
- Bidirectional Slack ack flow
Contract with the detectors
The dashboard is read-only and parser-driven. It does not mutate the SQLite schema or anomaly contract. Schema-drift rendering uses regex parsers (schema_parser.py) against the existing detect_schema_drift message format. If the message format ever changes, the parser tests will fail loudly.